
We read the financial chapters of 1 Doc International Berhad's draft prospectus and rebuilt the key tables: revenue by service and by product, margins, customer and centre economics, cash, prepaid packages, dividends, related-party items and the planned use of IPO money.
Article type: Financial analysis (company data) · Scope: 1 Doc International Berhad group, FY2022 to H1 FY2025 (six months to 30 June 2025) · Research period: 24–25 September 2026
Written by: Lay Kim Oon · Fact-checked by: Chutinun Krisnakupt · Last reviewed: 25 September 2026
Source document: draft prospectus on the Securities Commission Malaysia prospectus-exposure page (exposure 14 January 2026, updated 22 May 2026; latest practicable date 1 December 2025). Figures are audited combined figures unless marked "unaudited". · Corrections: contact form
Quick answer
1 Doc International is a high-margin, cash-generative beauty-centre chain. FY2024 revenue was RM346.96 million, the gross margin 81.8% and the profit-after-tax (PAT) margin 28.0%, and revenue grew at a 34.5% compound annual rate from FY2022. Own-brand products made RM60.66 million (17.5% of revenue) at a gross margin of about 88%, higher than the 80.5% earned on treatments. The balance sheet runs on customer prepayments: at 30 June 2025 the group held RM306.61 million cash against RM305.06 million of unused treatment packages. All figures come from a draft prospectus and may change in the registered version. This is a business analysis, not investment advice.
Key takeaways
- Growth is slowing, then recovering. Revenue rose 57.6% in FY2023, 14.7% in FY2024 and 27.3% in H1 FY2025. PAT rose 78.4%, 8.2% and 36.9%.
- Products are a high-margin minority. Product sales were 17.5–18.9% of revenue from FY2023, at 88–89% gross margin versus 80–82% for services.
- Slim Doc drove growth. Body care went from RM34.5 million (FY2022) to RM150.8 million (FY2024), while facial care fell 2% in FY2024.
- Prepayments fund the business. Unused package value reached 81.5% of FY2024 revenue. Before H1 FY2025, current liabilities exceeded current assets for this reason.
- Payouts are generous. Ordinary dividends declared for FY2022–FY2024 totalled RM169.5 million, 71.5% of PAT. A further RM40 million was paid in 2025, and up to RM75 million more is planned before listing.
- Related-party items are disclosed, not large. They include two consultancy arrangements, a RM12 million purchase of Perfect Facelift that the prospectus says was not at arm's length, and interest-free advances from directors that have now been settled.
Who this analysis is for
This analysis is for brand owners, contract manufacturers and industry analysts who want to see how a Malaysian service chain with its own product brands makes money. It shows which lines grow, what products earn versus treatments, and how cash moves. For the business model, outlets and supply chain, read our profile first: Company to Watch: 1 Doc International.
How we calculated the ratios
Every ratio below is our own calculation from figures stated in the prospectus. We give the formula so you can check it. Where the prospectus publishes the same ratio, our result matches it.
| Ratio | Formula used | Prospectus source |
|---|---|---|
| Gross / PBT / PAT margin | Gross profit, PBT or PAT ÷ revenue | §2.9, §12.1 (p. 11–12, 253–254) |
| EBITDA margin | EBITDA as computed by the company ÷ revenue | §12.1 (p. 254) |
| Growth / CAGR | (Current ÷ prior) − 1; CAGR = (FY2024 ÷ FY2022)^(1/2) − 1 | §12.1 |
| Product sales | Sum of "sales of body / facial / hair care and related products" | §12.3.3(i) (p. 262) |
| Product gross margin | (Product sales − product cost of sales) ÷ product sales | §12.3.4(ii) (p. 275) |
| Service revenue per session | Service revenue ÷ total sessions | §12.3.3(i), (vi) (p. 262, 266) |
| Revenue per customer | Revenue ÷ customers with ≥1 transaction | §7.1.6 (p. 105) |
| Revenue per average centre | Revenue ÷ ((opening centres + closing centres) ÷ 2) | §12.3.3(iv) (p. 265) |
| Cash cover of prepaid packages | Cash and cash equivalents ÷ contract liabilities | §12.1.2, §12.4 (p. 255, 311) |
| Operating cash conversion | Net cash from operating activities ÷ PAT | §12.3.12(ii) (p. 299) |
| Payout ratio | Ordinary dividends declared for the year ÷ PAT | §12.5 (p. 312) |
H1 figures are six-month periods and are not annualised unless stated.
Revenue and profit, FY2022 to H1 FY2025
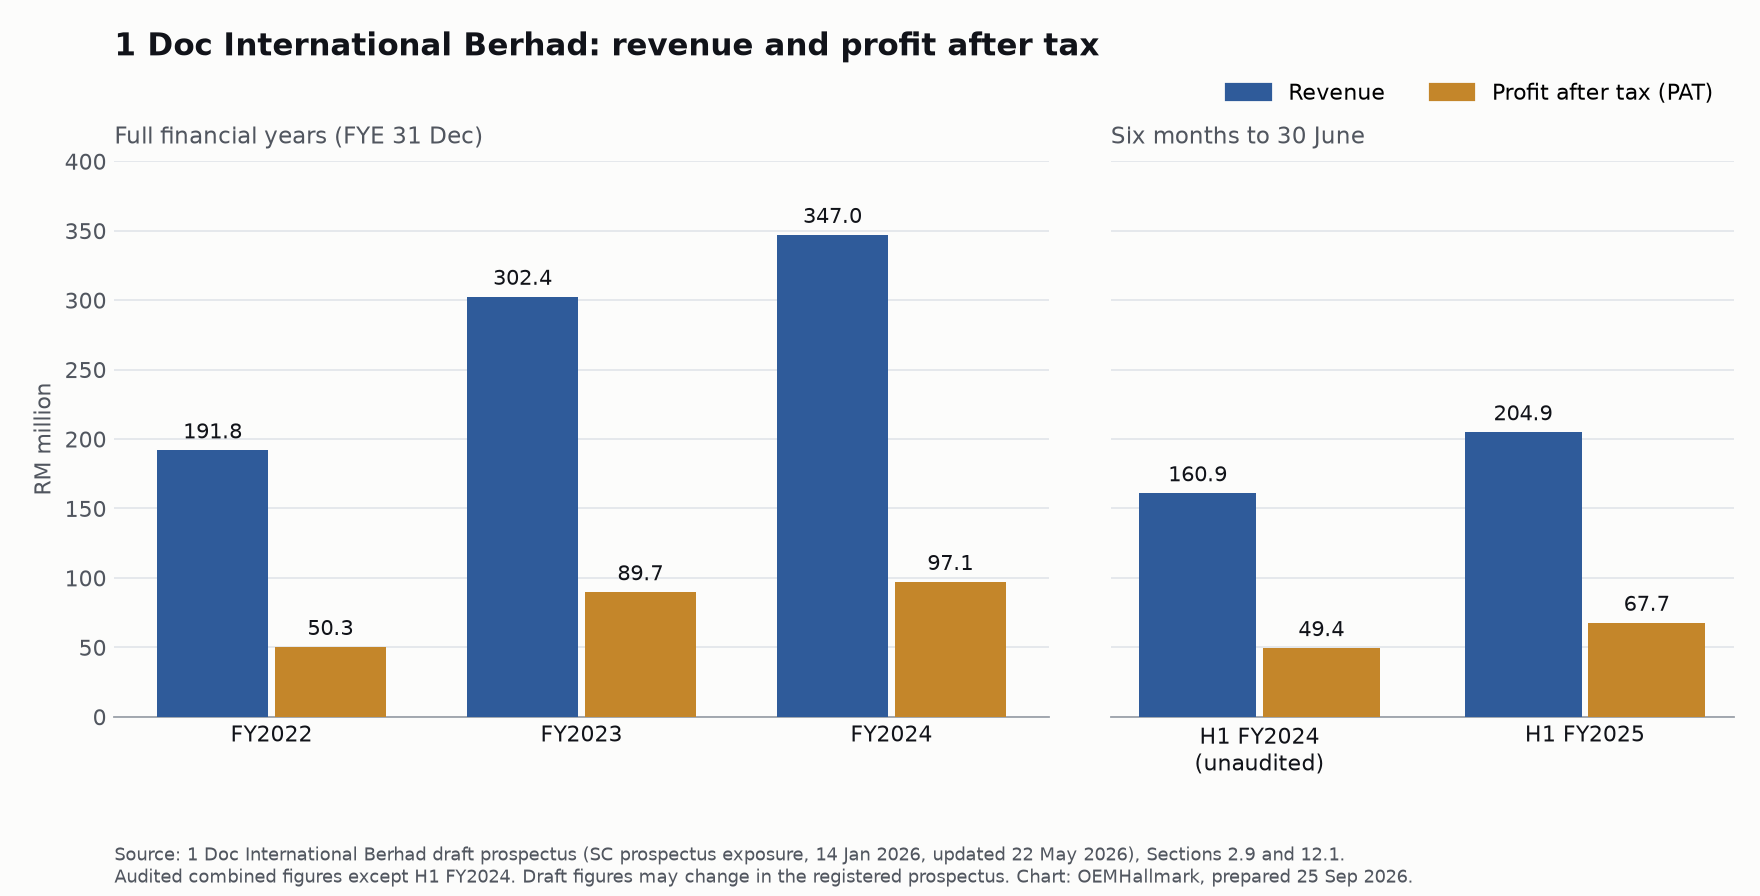
Revenue almost doubled in three years to RM346.96 million, and margins widened. H1 FY2025 posted the highest margins so far, helped partly by a one-off RM3.50 million debt waiver.
| RM million | FY2022 | FY2023 | FY2024 | H1 FY2024 (unaudited) | H1 FY2025 |
|---|---|---|---|---|---|
| Revenue | 191.83 | 302.41 | 346.96 | 160.94 | 204.86 |
| Cost of sales | (35.87) | (49.94) | (63.00) | (26.40) | (34.14) |
| Gross profit | 155.96 | 252.47 | 283.96 | 134.54 | 170.72 |
| Other income | 0.32 | 1.84 | 5.87 | 2.64 | 7.06 |
| Selling and distribution | (53.38) | (82.07) | (90.91) | (43.22) | (48.41) |
| Administrative and other | (35.92) | (50.86) | (64.19) | (27.45) | (36.42) |
| Finance costs | (0.69) | (1.61) | (2.23) | (1.09) | (1.10) |
| PBT | 66.29 | 119.78 | 132.50 | 65.42 | 91.84 |
| PAT | 50.25 | 89.67 | 97.05 | 49.44 | 67.67 |
| EBITDA (company-computed) | 78.20 | 137.37 | 156.65 | 74.36 | 100.76 |
| Gross margin | 81.3% | 83.5% | 81.8% | 83.6% | 83.3% |
| EBITDA margin | 40.8% | 45.4% | 45.2% | 46.2% | 49.2% |
| PBT margin | 34.6% | 39.6% | 38.2% | 40.7% | 44.8% |
| PAT margin | 26.2% | 29.7% | 28.0% | 30.7% | 33.0% |
| Effective tax rate | 24.2% | 25.1% | 26.8% | 24.4% | 26.3% |
Source: §12.1.1 (p. 253), §12.1 EBITDA table (p. 254), §12.3.10 (p. 292).
| Growth | FY2023 vs FY2022 | FY2024 vs FY2023 | H1 FY2025 vs H1 FY2024 | CAGR FY2022–FY2024 |
|---|---|---|---|---|
| Revenue | +57.6% | +14.7% | +27.3% | +34.5% |
| PAT | +78.4% | +8.2% | +36.9% | +39.0% |
| Product sales | +118.4% | +6.4% | +32.9% | +52.4% |
Adjusting for the one-off. H1 FY2025 other income includes a RM3.50 million waiver of amounts owed to former directors and shareholders (§12.3.6). Without it, H1 FY2025 PBT would be RM88.34 million, a 43.1% PBT margin instead of 44.8%. That is still the best in the series. Interest income is also rising (RM4.61 million in FY2024), because cash balances are large.
How much comes from treatments versus products?
Treatments bring in about 82% of revenue. Own-brand products bring in about 18%, but at a higher gross margin, so they earn close to one-fifth of gross profit.
| RM million | FY2022 | FY2023 | FY2024 | H1 FY2024 | H1 FY2025 |
|---|---|---|---|---|---|
| Body care services | 31.13 | 88.19 | 128.11 | 56.89 | 70.92 |
| Facial care services | 85.86 | 102.10 | 101.13 | 48.41 | 60.11 |
| Hair care services | 48.74 | 55.11 | 57.07 | 27.15 | 35.97 |
| Services total | 165.73 | 245.39 | 286.30 | 132.46 | 167.01 |
| Body care products | 3.42 | 16.16 | 22.65 | 9.78 | 16.53 |
| Facial care products | 13.42 | 23.83 | 22.26 | 11.06 | 12.28 |
| Hair care products | 9.27 | 17.03 | 15.76 | 7.64 | 9.05 |
| Products total | 26.10 | 57.02 | 60.66 | 28.48 | 37.85 |
| Products as % of revenue | 13.6% | 18.9% | 17.5% | 17.7% | 18.5% |
Source: §12.3.3(i) (p. 262). Totals computed.
| Gross margin | FY2022 | FY2023 | FY2024 | H1 FY2024 | H1 FY2025 |
|---|---|---|---|---|---|
| Services (all) | 81.2% | 82.2% | 80.5% | 82.3% | 82.2% |
| Products (all) | 81.9% | 89.0% | 88.4% | 89.8% | 88.3% |
| of which body care products | 85.5% | 89.9% | 91.9% | 92.2% | 91.8% |
| of which facial care products | 86.4% | 89.3% | 87.5% | 89.0% | 86.4% |
| of which hair care products | 74.0% | 87.6% | 84.8% | 88.0% | 84.3% |
| Products' share of group gross profit | 13.7% | 20.1% | 18.9% | 19.0% | 19.6% |
Formula: (segment revenue − segment cost of sales) ÷ segment revenue. Source: §12.3.4(ii) and §12.3.5(i) (p. 275, 279–280).
What this tells a product maker. The product lines cost the group about RM7.03 million to deliver in FY2024 and sold for RM60.66 million, so the cost of goods was about 12% of the price. That margin comes from selling through the group's own centres, with therapist commissions and marketing counted separately under selling expenses. It is not directly comparable with a brand selling through retailers. Our guide to pricing strategies for private-label beauty products explains how channel choice changes the margin you can keep.
Where the product growth stalled. Facial and hair product sales fell in FY2024, by 6.6% and 7.5%. The prospectus links this to lower sales at existing One Doc x Hair Doc centres, where customers switched to cheaper facials and bought fewer Pico Pulse packages (§12.3.3). In H1 FY2025, body care products (Slim Doc) rose 69.0% and overtook facial products as the biggest product line.
Which brands and segments carry the group?
Slim Doc turned the group from a facial business into a body-care business within three years. Perfect Doc is still small and its margin is well below the other brands.
| Revenue by brand (RM million) | FY2022 | FY2023 | FY2024 | H1 FY2025 |
|---|---|---|---|---|
| One Doc x Hair Doc (Malaysia) | 157.29 | 197.04 | 190.72 | 111.05 |
| Slim Doc (Malaysia) | 34.54 | 103.70 | 149.01 | 86.18 |
| Perfect Doc (Malaysia) | – | 1.67 | 6.22 | 5.37 |
| One Doc x Hair Doc (Singapore) | – | – | 1.00 | 2.27 |
| Gross margin by brand | FY2022 | FY2023 | FY2024 | H1 FY2025 |
|---|---|---|---|---|
| One Doc x Hair Doc (Malaysia) | 82.4% | 84.6% | 81.3% | 83.5% |
| Slim Doc (Malaysia) | 76.2% | 83.1% | 84.5% | 85.8% |
| Perfect Doc (Malaysia) | – | (31.0%) | 41.9% | 44.9% |
| Singapore | – | – | 33.8% | 74.9% |
Source: §12.3.3(ii) (p. 263) and §12.3.5(ii) (p. 281). A negative figure is a gross loss.
Perfect Doc's weak margin matters because 12 of the 23 planned Malaysian centres are Perfect Doc (§4.4). The prospectus puts the FY2023 gross loss down to four centres still ramping up (§12.3.5). Perfect Facelift Sdn Bhd, the company that runs Perfect Doc, also recorded a loss after tax of RM2.74 million in FY2024 (§10.1.1, note 4).
One Doc x Hair Doc is the mature brand. Same-centre sales fell 8.1% in FY2024 as customers moved to lower-priced facials: average value per facial session fell from RM684 to RM609. Revenue from the premium One Doc Pico Pulse service fell 15.9% to RM47.65 million. Same-centre sales then recovered by 16.7% in H1 FY2025 (§12.3.3(viii)).
Customer and centre economics
The average customer spent about RM4,300 a year and came in roughly six times. The average centre earned about RM7.5 million a year.
| Unit metric | FY2022 | FY2023 | FY2024 | H1 FY2025 |
|---|---|---|---|---|
| Customers (≥1 transaction) | 58,388 | 60,104 | 80,066 | 48,167 |
| Revenue per customer (RM) | 3,285 | 5,031 | 4,333 | 4,253 (6 months) |
| Treatment sessions | 303,208 | 406,932 | 468,288 | 264,567 |
| Sessions per customer | 5.2 | 6.8 | 5.8 | 5.5 (6 months) |
| Service revenue per session (RM) | 547 | 603 | 611 | 631 |
| Centres, end of period | 34 | 44 | 49 | 52 |
| Revenue per average centre (RM m) | 6.98 | 7.75 | 7.46 | 4.06 (6 months) |
| Same-centre sales growth | – | +24.0% | +2.2% | +22.2% (vs H1 FY2024) |
| Centre staff (cost-of-sales headcount) | 332 | 430 | 513 | 561 |
| Revenue per centre staff member (RM '000) | 578 | 703 | 676 | – |
Sources: customers §7.1.6 (p. 105); sessions and same-centre growth §12.3.3(vi)–(viii) (p. 266–267); centres §12.3.3(iv) (p. 265); headcount §12.3.4 (p. 276–277). Per-unit figures computed by OEMHallmark. Same-centre growth for H1 FY2025 compares with H1 FY2024.
The FY2023 jump in revenue per customer (to RM5,031) reflects Slim Doc's first full year of package sales. The dip in FY2024 came as the customer base grew 33% to 80,066. Customers from outside Malaysia rose from 0.4% to 8.3% of the Malaysian customer base between FY2022 and FY2024 (§7.1.6).
Where the money goes: cost structure
The biggest costs are therapist commissions (about 16% of revenue) and marketing (8–12%). Products and consumables cost only about 5% of revenue.
| % of revenue | FY2022 | FY2023 | FY2024 | H1 FY2025 |
|---|---|---|---|---|
| Centre staff costs (in cost of sales) | 9.9% | 9.0% | 9.9% | 9.9% |
| Input products and consumables | 6.6% | 5.1% | 4.9% | 5.1% |
| Machine depreciation (in cost of sales) | 2.1% | 2.3% | 3.4% | 1.6% |
| Therapist sales commissions | 15.8% | 16.0% | 16.2% | 15.5% |
| Marketing | 12.0% | 11.1% | 10.0% | 8.1% |
| Credit card and bank charges | 2.8% | 2.6% | 2.9% | 2.7% |
| Administrative and other expenses (total) | 18.7% | 16.8% | 18.5% | 17.8% |
Source: §12.3.4 (p. 274), §12.3.7 (p. 287), §12.3.8 (p. 288). Each line ÷ revenue.
For suppliers this is the key point. In FY2024 the group bought RM14.82 million of products and consumables in total (§7.16), about 4.3% of revenue. Its main manufacturer received RM8.87 million of that, about 2.6% of group revenue. Commissions paid to therapists for selling packages (RM56.09 million) were almost four times the whole product-and-consumables bill.
Cash, prepaid packages and borrowings
The group holds a lot of cash, but most of it is customers' money paid in advance. At 30 June 2025 cash of RM306.61 million roughly matched RM305.06 million of unused packages.
| RM million (at period end) | Dec 2022 | Dec 2023 | Dec 2024 | Jun 2025 |
|---|---|---|---|---|
| Cash and cash equivalents | 108.92 | 153.11 | 222.86 | 306.61 |
| Contract liabilities (unused packages) | 146.99 | 210.93 | 282.62 | 305.06 |
| Cash ÷ contract liabilities | 0.74× | 0.73× | 0.79× | 1.01× |
| Share of contract liabilities older than 12 months | 5.5% | 10.9% | 12.4% | 11.4% |
| Contract cost assets (commissions paid in advance) | 23.08 | 33.74 | 45.28 | 49.96 |
| Bank borrowings | 6.77 | 23.31 | 21.46 | 20.44 |
| Net cash (cash − bank borrowings) | 102.16 | 129.81 | 201.41 | 286.17 |
| Total equity | 26.87 | 52.27 | 57.41 | 125.06 |
| Current ratio | 0.83× | 0.81× | 0.82× | 1.01× |
| Gearing (bank borrowings ÷ equity) | 0.25× | 0.45× | 0.37× | 0.16× |
Source: §12.1.2 (p. 255), §12.3.12 (p. 297–305), §12.3.15 (p. 306–310), §12.4 (p. 311). Ratios computed except the current ratio and gearing, which match the prospectus.
Three observations:
- Prepayments are the working capital. Customers pay the full package price upfront for up to 12 months of treatments. The unearned balance becomes revenue as sessions are used, and unused balances expire into revenue over the following three years (§12.3.1). Contract liabilities at 81.5% of FY2024 revenue are why the group reported net current liabilities until mid-2025. The prospectus notes that, excluding them, it would have had net current assets of RM174.56 million at December 2024.
- Cash conversion is strong. Operating cash flow was 2.6×, 1.6× and 1.9× PAT in FY2022–FY2024, and 1.4× in H1 FY2025. Operating cash minus net investing cash was RM110.9 million, RM113.1 million, RM156.8 million and RM91.6 million (H1 FY2025).
- Debt is small and mostly property-linked. Bank borrowings of RM20.44 million at June 2025 were mainly Islamic term financing for the head office and investment properties. RM19.13 million was floating-rate. Interest cover was 60–97×. An unaudited figure at 1 November 2025 shows bank borrowings of about RM27.69 million, and total indebtedness of RM45.27 million including lease liabilities (§12.2).
Return on equity is very high, for a reason. FY2024 PAT of RM97.05 million on average equity of about RM54.8 million gives a return of roughly 177%. Equity is small because the group pays out most of its profit and funds itself with customer prepayments, not shareholder capital. Read the figure as a feature of the model, not a standalone measure of quality.
Dividends and shareholder payouts
The group has paid out most of what it earned, and plans another large dividend before listing.
| Ordinary dividends | FY2022 | FY2023 | FY2024 | 1 Jan 2025 to 1 Dec 2025 |
|---|---|---|---|---|
| Declared for the year (RM m) | 25.00 | 94.50 | 50.00 | 40.00 |
| PAT (RM m) | 50.25 | 89.67 | 97.05 | – |
| Payout ratio | 49.8% | 105.4% | 51.5% | – |
| Paid in cash during the year (RM m) | 25.00 | 64.50 | 80.00 | 40.00 |
Source: §2.10 (p. 13), §12.5 (p. 312–313).
- The FY2023 payout above 100% was drawn from retained earnings "to reward the existing shareholders" (§12.5).
- Holders of redeemable convertible preference shares (RCPS) received 4% of 1 Doc Holding's PAT: RM3.03 million, RM1.02 million and RM1.92 million for FY2022–FY2024. All RCPS were redeemed on 5 June 2025 for RM4.00 million.
- Planned before listing: additional dividends of up to RM75.00 million for FY2025, paid from internal funds (§12.5).
- Stated policy after listing: 50–70% of PAT.
Related-party items
Section 10 discloses several related-party dealings. All are small next to profits, and the prospectus says most will stop at listing. We list them as the document states them.
| Item | Amounts | Prospectus position |
|---|---|---|
| Interest-free advances from, and expenses paid by, directors and shareholders | Varied; e.g. RM4.77 million paid by the CEO on the group's behalf in H1 FY2025 | Not at arm's length (interest-free); settled by 1 Dec 2025; will not continue |
| Consultancy by the chairman's sole proprietorship (Al Badr Resources) | RM817,498 for 2020 to Jan 2022, then RM18,000 a month to Sep 2025; plus 30 RCPS (2% of PAT a year, redeemed for RM2.00 million) | Unable to confirm arm's length; terminated 30 Sep 2025 |
| Consultancy by Grade Competence Sdn Bhd (linked to a former director) | Same structure and amounts as above | Unable to confirm arm's length; terminated 30 Sep 2025 |
| Purchase of Perfect Facelift by Slim Doc from directors' spouses and relatives | RM12.00 million (2024); target had net liabilities of RM3.35 million at Dec 2023 | Not at arm's length; one-off |
| Waiver of amounts owed to former directors and shareholders | RM3.50 million, booked as other income in H1 FY2025 | One-off |
| Rental of an employee apartment from the CEO's spouse | RM2,500 a month | Arm's length; ended Feb 2025 |
| Personal guarantees by founders on bank facilities and some tenancies | Two Sunway tenancies (6.0% of FY2024 revenue) remain personally guaranteed | Landlord would not release before listing |
Source: §10.1 (p. 226–247).
A private valuation marker. A co-founder sold his 37.5% stakes in 1 Doc Holding and Slim Doc to the three remaining founders in September–October 2024 for RM100 million in total. The prospectus describes this as about 2.87 times the two companies' combined FY2023 PAT of RM93.02 million (§10.1.1, note 2). The IPO price is not yet set, so this private deal is the only price reference in the document.
What will the IPO money be used for?
The draft lists the uses of IPO money but leaves every ringgit amount blank. Until the final prospectus, the size of each item is unknown.
| Use of public-issue proceeds (§4.4, p. 30–40) | Detail given | Timeframe |
|---|---|---|
| 18 new centres in Malaysia | Part of 23 planned for 2026–2029 (12 Perfect Doc, 8 Slim Doc, 3 One Doc x Hair Doc) | Within 36 months |
| 7 new centres in Singapore | Part of 8 planned for 2026–2028 | Within 36 months |
| Machines for new centres | Light pulse, ultrasonic, EMS, cooling, RF, LLLT devices | Within 36 months |
| Acquisition of medical aesthetic clinics | LCP doctors; Botox, fillers, microneedling; no targets identified yet | Within 36 months |
| Repayment of head-office term loan | Public Bank, 4.17% p.a. | Within 3 months |
| Refurbishment of 30 existing centres | Renovation and fittings | Within 36 months |
| Warehouse (Selangor, up to 8,000 sq ft) and Singapore office/warehouse (~6,000 sq ft) | Purchase and rental | Within 36 months |
| Working capital | Marketing, staff, inventory, rent | Within 24 months |
| Listing expenses | Fees, underwriting, placement | Within 3 months |
The public issue is 341.4 million new shares. At any price, the proceeds are small next to the RM306.61 million cash already held, much of which is backed by customer prepayments. The IPO is as much about access to capital and giving shareholders a market as about funding.
Key risks visible in the numbers
Four risks stand out when the tables are read together: growth depends on one brand, prepayment-funded cash depends on continued package sales, the expansion leans on the lowest-margin brand, and products come mainly from one factory.
- Growth concentration. Slim Doc produced most of the FY2023–FY2024 growth, while One Doc x Hair Doc's same-centre sales fell 8.1% in FY2024. The prospectus warns that the 34.49% growth rate may not be sustained (§9.1.5).
- Prepayment dependence. A fall in new package sales would reduce cash inflow before it shows in revenue. Package sales are discretionary consumer spending (§9.1.1).
- Expansion mix. Perfect Doc makes up over half of the planned Malaysian centres but earned a 41.9–44.9% gross margin, against 81–86% for the other brands.
- Supplier concentration. One manufacturer supplied 51–69% of purchases (§7.16, §9.1.3). This is cheap relative to revenue but hard to replace quickly. See our note on protecting your formula and IP with an OEM manufacturer.
- Regulatory scope. Machine-based treatments are allowed under KPDN's Beauty Guidelines. Any tightening, or a move into doctor-led medical aesthetics, would change costs and risk (§9.1.2, §9.1.7).
- Disclosed compliance gaps. 14 premises had renovation approvals pending as at March 2026 (21.83% of FY2024 revenue). The company estimates the worst-case relocation cost at RM8.95 million (§7.24).
What the numbers mean for brand owners and manufacturers
The 1 Doc accounts show that for a service-led beauty brand, the product line is small in revenue but valuable in margin, and the factory's share of the customer's spend is tiny. Practical implications:
- For clinic and centre owners planning a house brand: products can plausibly reach 15–20% of revenue at close to 90% gross margin in a captive channel. That only works if the formula is yours and the factory is contractually barred from reusing it.
- For manufacturers: a chain of this size bought only about RM15 million of products and consumables a year. Winning such an account is about reliability, notification support and exclusivity terms, not headline volume. The questions in our checklist before signing an OEM cosmetics contract apply in both directions.
- For anyone benchmarking: use the service-versus-product split, not the group gross margin. The 81–84% group figure hides an 88%+ product margin and a much lower margin on new-brand services.
If you are selecting a manufacturer for a service-led range, start with our guide to choosing an OEM cosmetics manufacturer.
FAQ
What was 1 Doc International's revenue and profit in FY2024?
According to the draft prospectus, revenue was RM346.96 million and profit after tax RM97.05 million in the year to 31 December 2024, a PAT margin of 28.0%. For the six months to 30 June 2025, revenue was RM204.86 million and PAT RM67.67 million. These figures may be revised in the registered prospectus.
How much of 1 Doc's revenue comes from product sales?
Product sales were RM60.66 million in FY2024, or 17.5% of revenue, split across body (RM22.65 million), facial (RM22.26 million) and hair (RM15.76 million) products. In H1 FY2025 they were RM37.85 million (18.5%). The rest of revenue is treatment services.
What gross margin does 1 Doc earn on its own products?
About 88% in FY2024 by our calculation: product sales of RM60.66 million minus product cost of sales of about RM7.03 million, divided by product sales. Body care products were highest at about 92%. The margin reflects sales through the group's own centres, with commissions and marketing booked separately.
Why does 1 Doc have such high cash balances?
Customers pay for 12-month treatment packages upfront. The unused balance, RM305.06 million at 30 June 2025, is held as contract liabilities while the cash sits on the balance sheet. Cash of RM306.61 million at that date was about equal to this prepaid balance, so much of it is committed to future treatments.
Does 1 Doc International pay dividends?
Yes. It declared ordinary dividends of RM25.0 million, RM94.5 million and RM50.0 million for FY2022–FY2024, then RM40.0 million in 2025, with up to RM75.0 million more planned before listing. After listing it targets paying out 50–70% of PAT, subject to board discretion.
How much will 1 Doc International raise from its IPO?
The draft prospectus does not say. It fixes the number of new shares at 341.4 million but leaves the IPO price and every proceeds amount blank. Planned uses include new centres in Malaysia and Singapore, machines, buying medical aesthetic clinics, refurbishment, a warehouse and repaying a head-office loan.
Sources and evidence
- Securities Commission Malaysia, Prospectus Exposure: 1 Doc International Berhad (exposure 14 January 2026, updated 22 May 2026). Sections and printed pages used: §2.1–2.10 (p. 5–14); §4.4 use of proceeds (p. 30–41); §7.1.6 customers (p. 105–106); §7.16 suppliers (p. 162–165); §7.24 non-compliances (p. 190–195); §9 risk factors (p. 211–225); §10 related-party transactions (p. 226–248); §12.1–12.5 financial information and MD&A (p. 253–313).
- Accountants' Report (prospectus §13), prepared by Moore Stephens Associates PLT; pro forma assurance letter dated 17 December 2025.
- Companion profile: Company to Watch: 1 Doc International (NPRA snapshot 3–5 September 2026; Google Maps capture 24–25 September 2026).
Limitations
All figures come from a draft prospectus that has not been registered. Figures, section numbering and page numbers may change in the final version, and the IPO price and proceeds are blank. H1 FY2024 figures are unaudited. The financial statements are combined statements for a group put together through a pre-IPO restructuring, so earlier years may not match what the listed entity would have reported. Per-customer, per-centre and per-session figures are our own calculations from company-stated inputs, and six-month figures are not seasonally adjusted. We did not audit the accounts, visit centres or interview the company.
Update history
| Date | Change |
|---|---|
| 27 September 2026 | First published |